Worldwide Missiles Systems
Analysis
A Complete Interactive Power BI Report
Tech Stack
Power BI Desktop, Power Query, DAX, Mashup language, Power BI Services, Seaborn, Pandas
Project
Research, wrangling & analysis of several datasets that were then modeled into a star schema. All the data was leveraged to build an interactive Power BI report.
Benefits
Reports are key information that support decision makers to make better informed decision and get relevant, up-to-date data on key metrics.
Goals
Developing Reporting, Visualization & Data Analysis skills.
I first made a research online to get more variables on missiles' system. I then prepped them and modeled out a star schema that I then used to into visualizations that built up the Report pages. After I designed all the interactions and navigation, I reviewed it several time before publishing it.
Why Missiles?
I didn’t expect to be building a data report about missiles. But here we are.
It all started with a newsletter from Reuven, a brilliant Israeli data expert I follow. Every week, he sends out a new dataset with a bunch of thoughtful questions to explore. Last week — right after the Israeli strikes on Iran in early June 2025 — the topic he picked was, well... missiles. Living in Israel myself, let’s just say the subject hit close to home. Quite literally. It felt like the dataset had been delivered to me on a silver platter.
So I dove in.
I didn’t approach this project as a defense analyst, but as a curious data guy. I wanted to turn a serious and complex topic into something insightful and accessible — using the tools I love: Power BI, Power Query, DAX, and a good dose of creativity. This report is about visualizing the technical data behind missile systems and making sense of it through filters, graphs, correlations, and maps.
For recruiters and data teams out there: this project reflects how I approach data — with curiosity, structure, and a drive to make it meaningful.
What Angles?
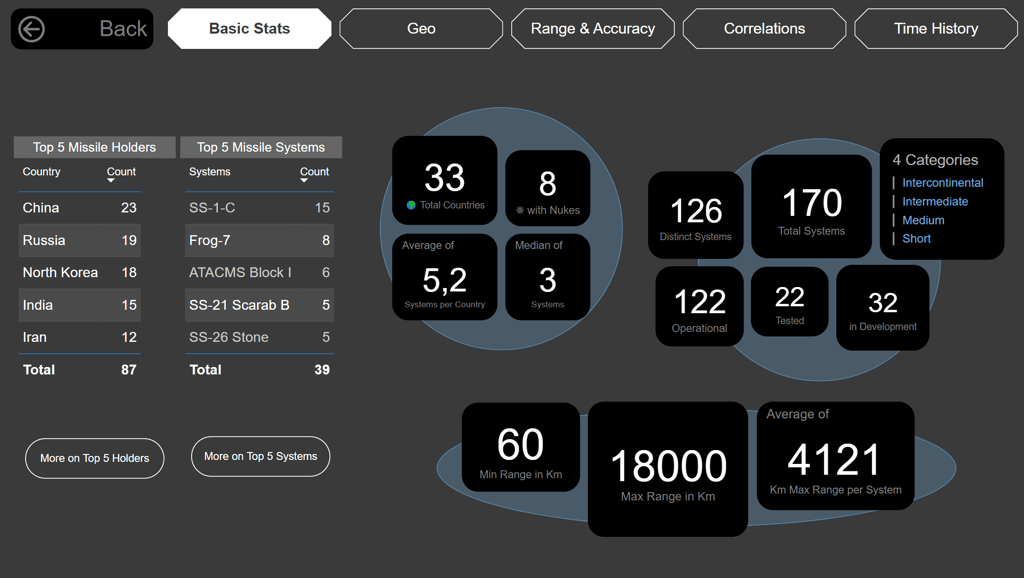
The first page of the report — "Basic Stats" — is designed as the appetizer of the entire data journey. Like the entrée in a good meal, it gives just enough flavor to spark curiosity, without overwhelming you. It sets the tone, teases some of the highlights, and invites you to dive deeper.
The layout is clean and symmetrical, with a dark theme contrasted by pale yellow and soft blue accents, creating a modern and slightly futuristic look — fitting for a subject like missile systems. This page is all about setting context: who holds missiles, how many types exist, how far they can go, and how dangerous they might be.
You’ll immediately notice two clear top-five tables:
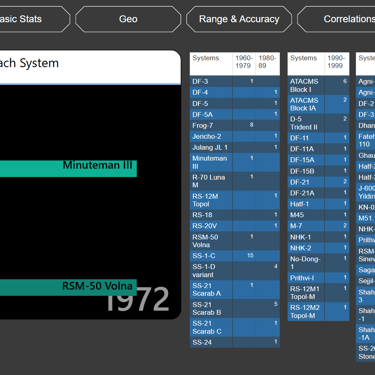
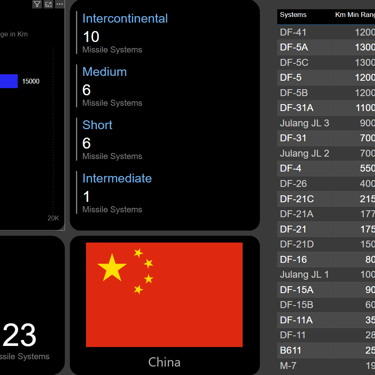
Top 5 Missile Holders (led by China, Russia, and North Korea)
Top 5 Missile Systems (like the SS-1-C and Frog-7)
These are quick stats, designed to give the viewer an immediate grasp of where concentration and repetition exist. Right below, buttons allow further exploration of each list, acting as branching points to dive deeper — like choosing a main course after scanning the menu.
To the right, I’ve added some high-level figures displayed in stylized cards:
33 countries operate missile systems
170 total systems tracked
8 of them are nuclear-capable
An average of 5.2 systems per country
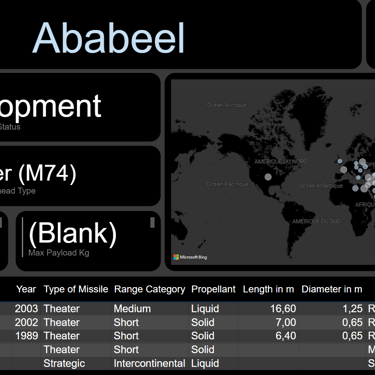
I’ve also made sure to highlight the different status categories — operational, tested, or still in development — because not all missiles are equal when it comes to threat level or readiness.
Visually, I treated this like a dashboard you'd want to explore, not just observe. Everything is meant to be clickable, clean, and digestible, with room to breathe. The layout encourages interaction without losing focus — this isn’t just a Power BI file full of charts; it’s an experience.
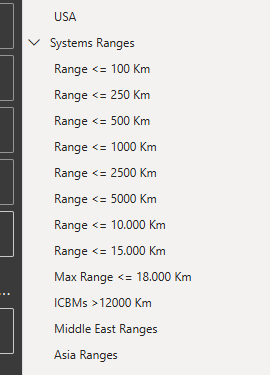
And finally, at the bottom: an intro to ranges — a key dimension of any missile system. You’ll see a range from 60 km to a staggering 18,000 km, and an average max range of just over 4,000 km. Just enough data to raise eyebrows and questions like, "Who can hit whom from where?"
In short, this page is designed to excite, inform, and guide. It's the launchpad of the report, and I built it to create appetite for more — more maps, more correlations, more insight.
Unfortunately, I can’t share the report file itself publicly due to license restrictions on some of the source data. But transparency matters — so below, I’ve included a list of all the sources I used to build the report. You’re welcome to dive into them and even build your own version.
But here are each and all of the report pages in case the video did not satisfy your curiosity enough.
A Guided Tour — in 11 Minutes
To get the full picture of the report, I’ve recorded a short 11-minute video walkthrough that gives you a complete overview. In it, you’ll see how the report works, how the visuals respond in real time, and how everything ties together into a single interactive story. It’s not just a dashboard — it’s a living, breathing analysis that invites exploration.
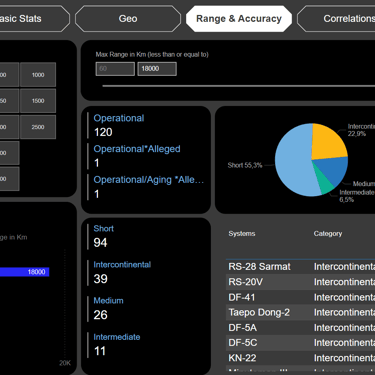
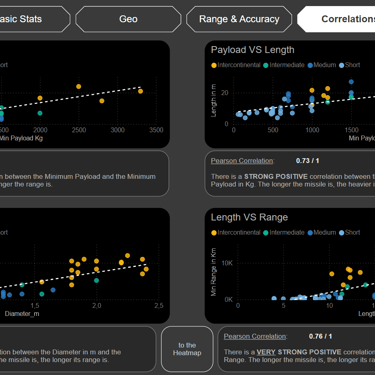
You'll see how I connected the data, designed with purpose, and built in filters, drilldowns, and visual cues to make navigation intuitive. Whether it’s tracking missile ranges across continents or uncovering correlations between payload and reach, the video shows how each element plays its role.
If you can't here a thing from the video this is completely normal.


Unfortunately, I can’t share the report file itself publicly due to license restrictions on some of the source data. But transparency matters — so below, I’ve included a list of all the sources I used to build the report. You’re welcome to dive into them and even build your own version.
Data Sources & References
Here are the sources used in compiling the missile dataset:
CSIS Missile Threat
https://missilethreat.csis.org
Detailed profiles, specs, and basing info for global missile systemsWikipedia (Missile Pages)
https://en.wikipedia.org
IOC years, dimensions, variants, operators, and historical contextArms Control Association
https://www.armscontrol.org/factsheets/missiles
Overview of missile programs and treatiesNTI – Nuclear Threat Initiative
https://www.nti.org
Country-specific strategic missile capabilitiesGlobalSecurity
https://www.globalsecurity.org
Historical and technical data, incl. alternate namesThe Military Balance (IISS)
https://www.iiss.org/publications/the-military-balance
Professional defense reference (used for cross-verification)FAS – Federation of American Scientists
https://fas.org
Strategic forces and weapon systems data
If you’d like to know more about how I built this — or want to explore how I could apply this same level of structure and creativity to your datasets — feel free to reach out!
I'm currently looking for a role as a Data Analyst here in Israel, and I’m excited to bring this mindset to a team that values insights, storytelling, and impact.