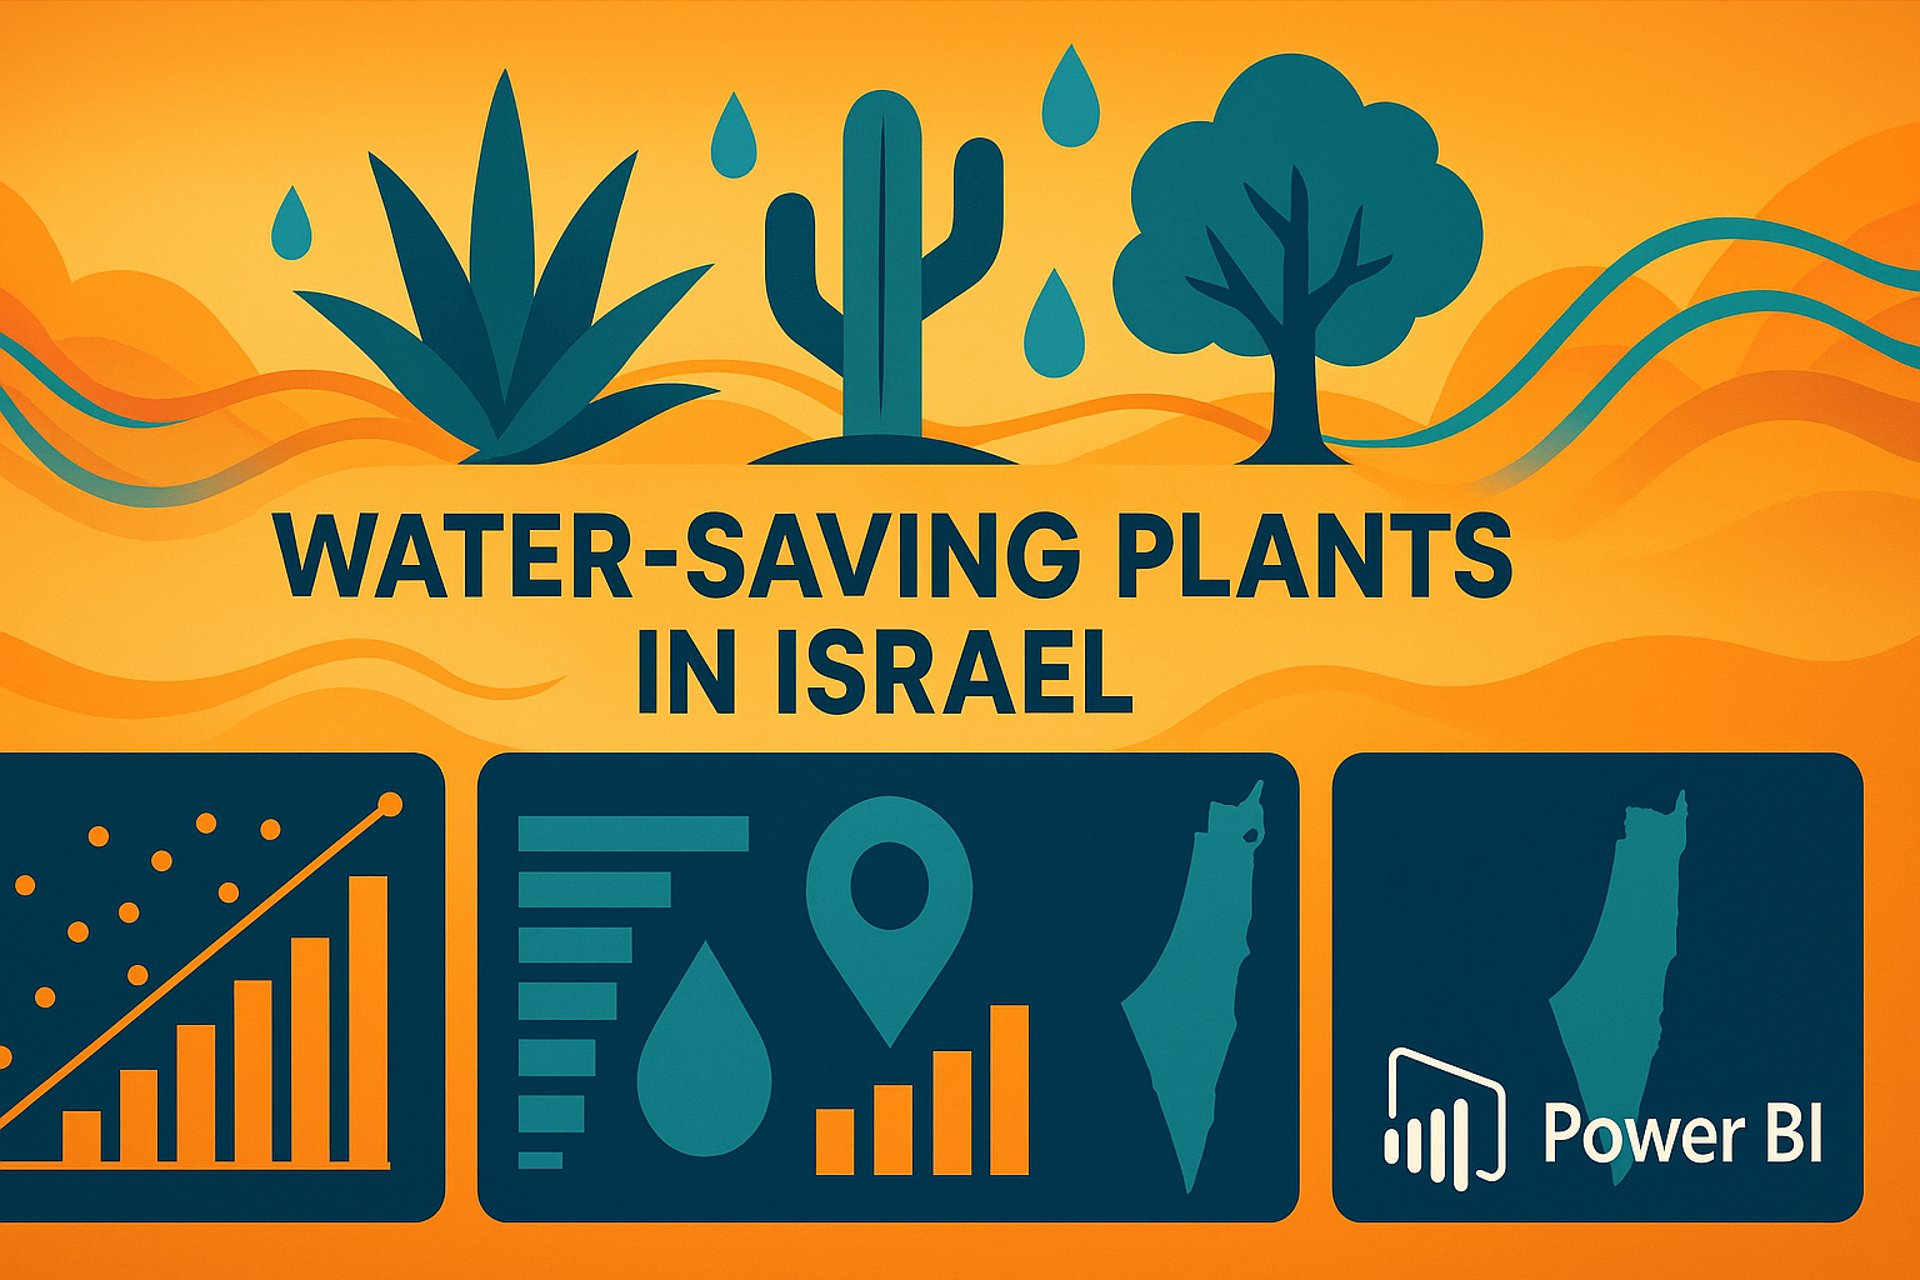
Water-Saving Plants in Israel: Application Report
A Complete Interactive, App-like, Power BI Report
Tech Stack
Power BI Desktop, Power Query, DAX, Power BI Services
Project
Research, wrangling & analysis of several datasets that were then modeled and designed into an interactive Power BI app report.
Benefits
Reports are key information that support decision makers to make better informed decision and get relevant, up-to-date data on key metrics.
Goals
Developing Reporting, Visualization & Data Analysis skills.
I first made a research online to get more variables on the water-saving plants listed in the first public dataset. I then prepped them and modeled out a star schema that I then used to into visualizations that built up an application report that is easy-to-use.
🌊 Summer Started: Let’s Be Careful About Our Water Consumption
Summer has arrived, and with it the sweltering heat that reminds us how precious water is. Living in Israel, a land that not long ago faced strict water restrictions, we know all too well that scarcity can return if we let our guard down.
Around the world, nations are already witnessing the stress on their water reserves—from parched reservoirs to rivers running dry—brought on by climate change and ever hotter summers. Now more than ever, saving every drop matters.
Israel leads the way in irrigation technology, pioneering drip systems and precision watering for decades. This expertise shines through in this Water-Saving Plants report, a practical showcase of Israeli know-how applied to everyday gardening.
🌱 Enhancing the Initial Dataset
The original dataset listed only plant names and an obscure, hard-to-understand water need.
Driven by environmental commitment, I enriched it: filters that include bees (pollinating insects), fly and mosquito-eating birds, exposure requirements, fruit-bearing flags, and more.
Play with the report and see—some plants both attract bees and keep mosquitoes at bay! That interplay of nature and data was a delightful surprise.
🚧 This Is Not a Final Work: More to Do
This report is a strong foundation, but far from complete.
Future enhancements could include additional insect categories, refined water thresholds, and precise mature plant surface coverage.
I welcome feedback, suggestions, or collaboration—reach out anytime.
Feel free to share this work freely; my hope is to help everyone choose plants that bloom beautifully and sip water responsibly.
🌐 Starting with Israeli National Data: data-gov.il
data-gov.il is Israel’s open data portal, offering official datasets from various governmental bodies.
I browsed its catalog until the Water-Saving Plants dataset caught my eye—Hebrew column names, right-to-left text, and all.
Mixing English and Hebrew in Power BI posed technical quirks (alignment, font support), but it also underscored Israel’s vibrant gardening culture.
Here, balconies and backyards are lush with potted plants; I’d say one in five Israelis invests time and money into this leisure, turning even small terraces into mini-oases.
🎯 My Approach for This Report: An Easy-to-Use App
As a data analyst, clarity is my north star. I designed this Power BI app for users who typically avoid data—so the visuals must guide them, not overwhelm. Clear navigation, intuitive filters, and visual cues transform complex tables into a friendly exploration.
Every chart, every color choice, every tooltip was crafted with the end-user in mind: gardeners, urban dwellers, or anyone curious about water-wise planting.
Take a look and use it freely. Here it is, ready to use for you just here:
Data Sources & References
All data sources are available in the report page on Data Sources.
🤝 For Recruiters and Fellow Data Enthusiasts
If you’re a recruiter seeking a data analyst who blends technical skill with user empathy, here’s my canvas: digging into open data, overcoming bilingual challenges, enriching raw tables, and crafting user-friendly BI experiences.
I’m always learning, always refining, and eager to solve real-world problems through data. Let’s talk about how we can make data delightful together.